Evaluation Cards: Quickstart
A stakeholder-agnostic guide to getting started. ~6 min.
Heads up: Evaluation Cards is in Beta. We'd love your feedback: report bugs, request features, or tell us what's confusing through our feedback form or the public roadmap. You can reach the feedback form from any page via Feedback in the top navigation.
What Evaluation Cards is
Evaluation Cards is a reporting layer over AI model evaluations, built by the EvalEval Coalition. It collects how AI models are evaluated across many benchmarks and reporting organizations, and also shows what was left undocumented.
A benchmark score on its own ("Model X scores 87% on MMLU") tells you very little. Evaluation Cards puts each score in context: who ran the evaluation, how it was set up, whether it can be reproduced, and whether it can be fairly compared to another score. The project treats every published evaluation as a claim, and every undisclosed detail as a claim deliberately not made. Neither is treated as an error.
At a glance (snapshot of June 2026), the corpus tracks:
| 5,816 models | 101,955 reported results |
| 31 reporting organizations | 820 model developers |
| 57 benchmark families | 632 single benchmarks |
The corpus is versioned by snapshot. Every page shows a snapshot date. Numbers above will drift as the corpus grows, so always cite the snapshot you saw.
The four interpretive signals
Every record is assessed against four signals. Learn to read them and most of the site falls into place.
| Signal | Question it answers | What a low score means |
|---|---|---|
| R · Reproducibility | Could a third party re-run this evaluation? | Prompts, decoding settings, harness version, seeds, or code are undisclosed. |
| C · Completeness | Does the record meet normal reporting expectations for this kind of model? | Whole categories (e.g. safety, robustness, fairness) may be missing. |
| P · Provenance & Risk | Who ran it, and what real-world property does it measure? | Distinguishes first-party (the developer) from third-party (independent) evaluators. |
| X · Comparability | Can two scores on the same benchmark be put side by side? | Different splits, metric variants, or units make a direct ranking invalid. |
A high benchmark score with weak signals is still a weak claim. The signals are how you tell a well-documented result from one you can't check.
The five-level hierarchy
Scores resolve through an explicit pathway, so any headline number can be drilled down to the evidence behind it:
Family → Composite → Single Benchmark → Split → Metric
For example: MMLU (family) → MMLU-Pro (composite) → a single benchmark → a split (e.g. a particular subject or language subset) → accuracy (metric). When you see an aggregate claim, you can always click down to the specific metric supporting it.
Getting around: the top navigation

- Overview (
/): the corpus snapshot, the signals explained, and featured benchmark families. Start here. - Models (
/models): every indexed model. Filter by parameter size, switch between Models and Developers views, and select up to four models to compare. - Evaluations (
/evals): benchmarks grouped into families, filterable by interaction style (agent / non-agent) and ~17 categories (Mathematics, Safety, Software Engineering, …). - Help (
/help): guides like this one, plus technical documentation on the signals and how to contribute data. - About (
/about): how the signals are computed and the principles behind the corpus. - Feedback (
/feedback): share feedback, request a feature, or report an issue.
Your first 5 minutes
- Open a model page. Go to Models, click any model (e.g. Claude Opus 4.7). This page is the model's evaluation record. Behind each number sits more than the page shows: the benchmark's own metadata and the evaluation run details, which is what actually makes the score interpretable.
-
Read the
DOCUMENTEDbadge. Near the top, a percentage (e.g. "36%, 14 / 39 reported") tells you for how many of the model's reported scores the prompting/run setup is documented well enough to re-run. The rest are missing details like temperature, max tokens, or the harness. (This is the model-level Reproducibility read; it's not about completed benchmark cards.) A low number here is common, and that's deliberate. -
Check "Who reports what" (§3). A donut and per-category bars split results into first-party (the developer's own numbers) vs third-party (independent). This is your fastest read on how independent the evidence is.
- Understand the Summary score. In Summary View each benchmark is shown leaderboard-style, ranked against peer models. When a model has more than one reported result for a benchmark, the score shown is the median of all reported results.
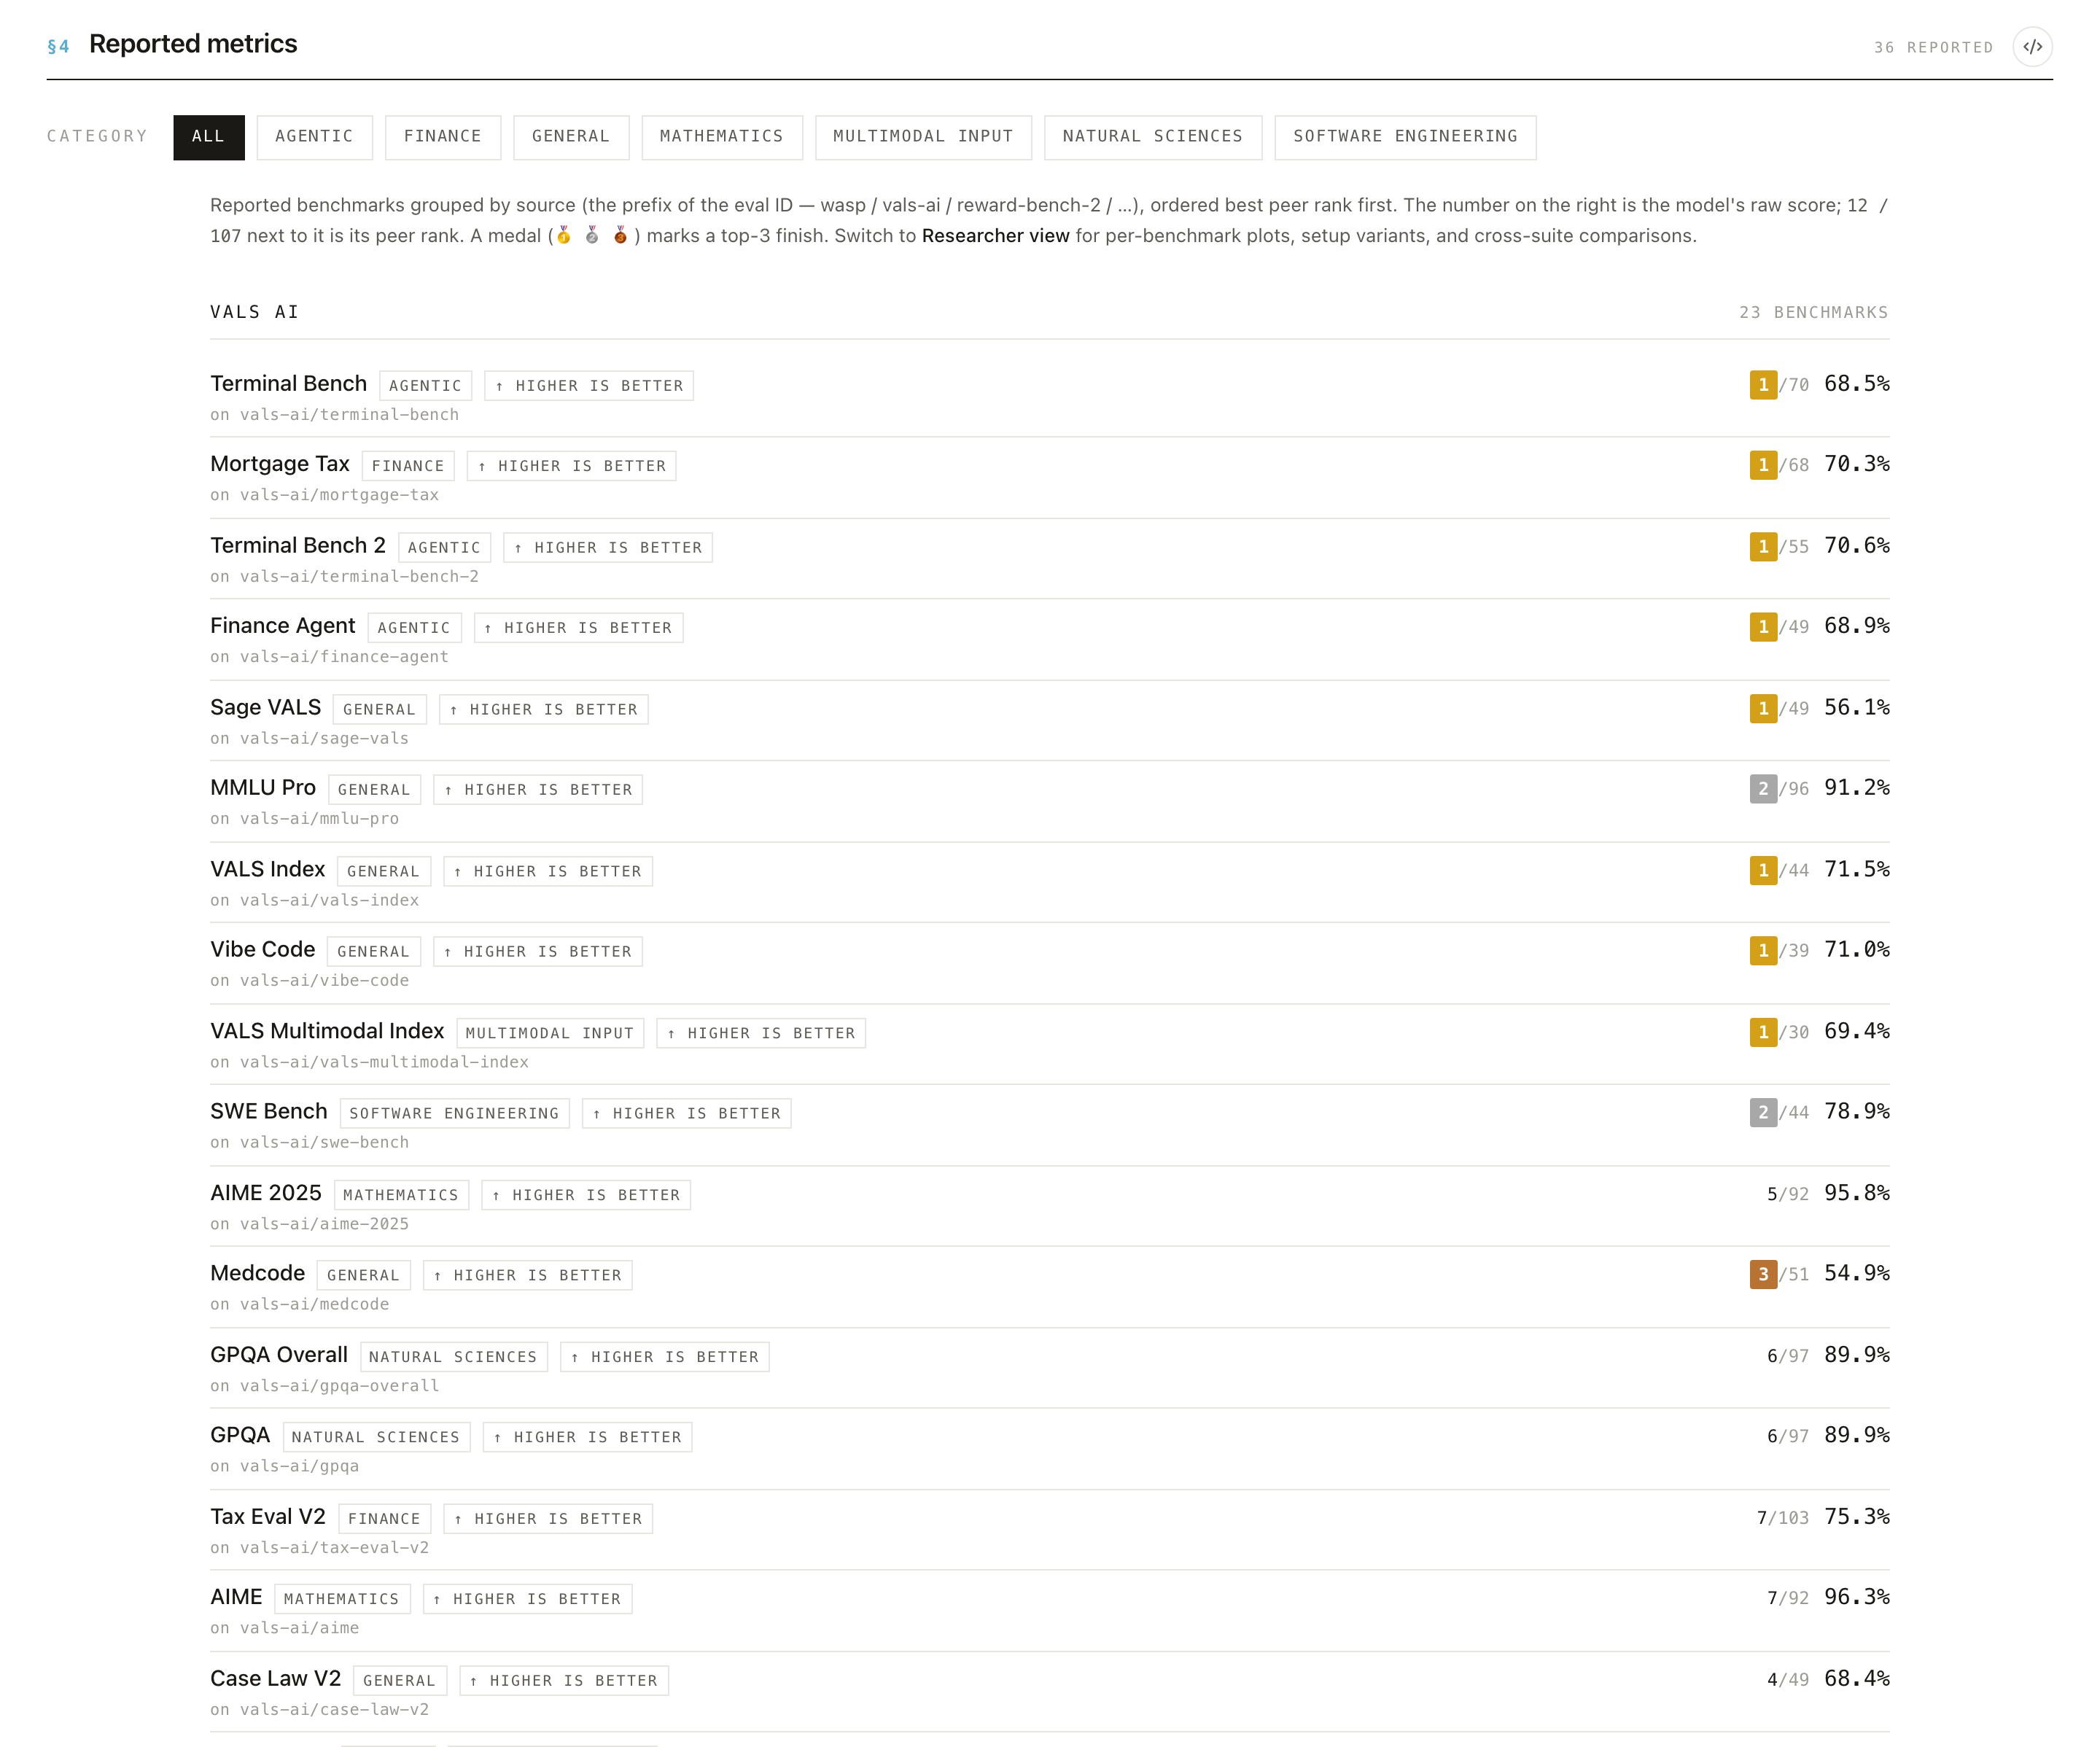
- Switch to Researcher View. The toggle in the bar at the top of the page swaps Summary for Researcher view, which exposes the underlying per-result detail. Use Summary to get oriented, and Researcher when you want to dig in.

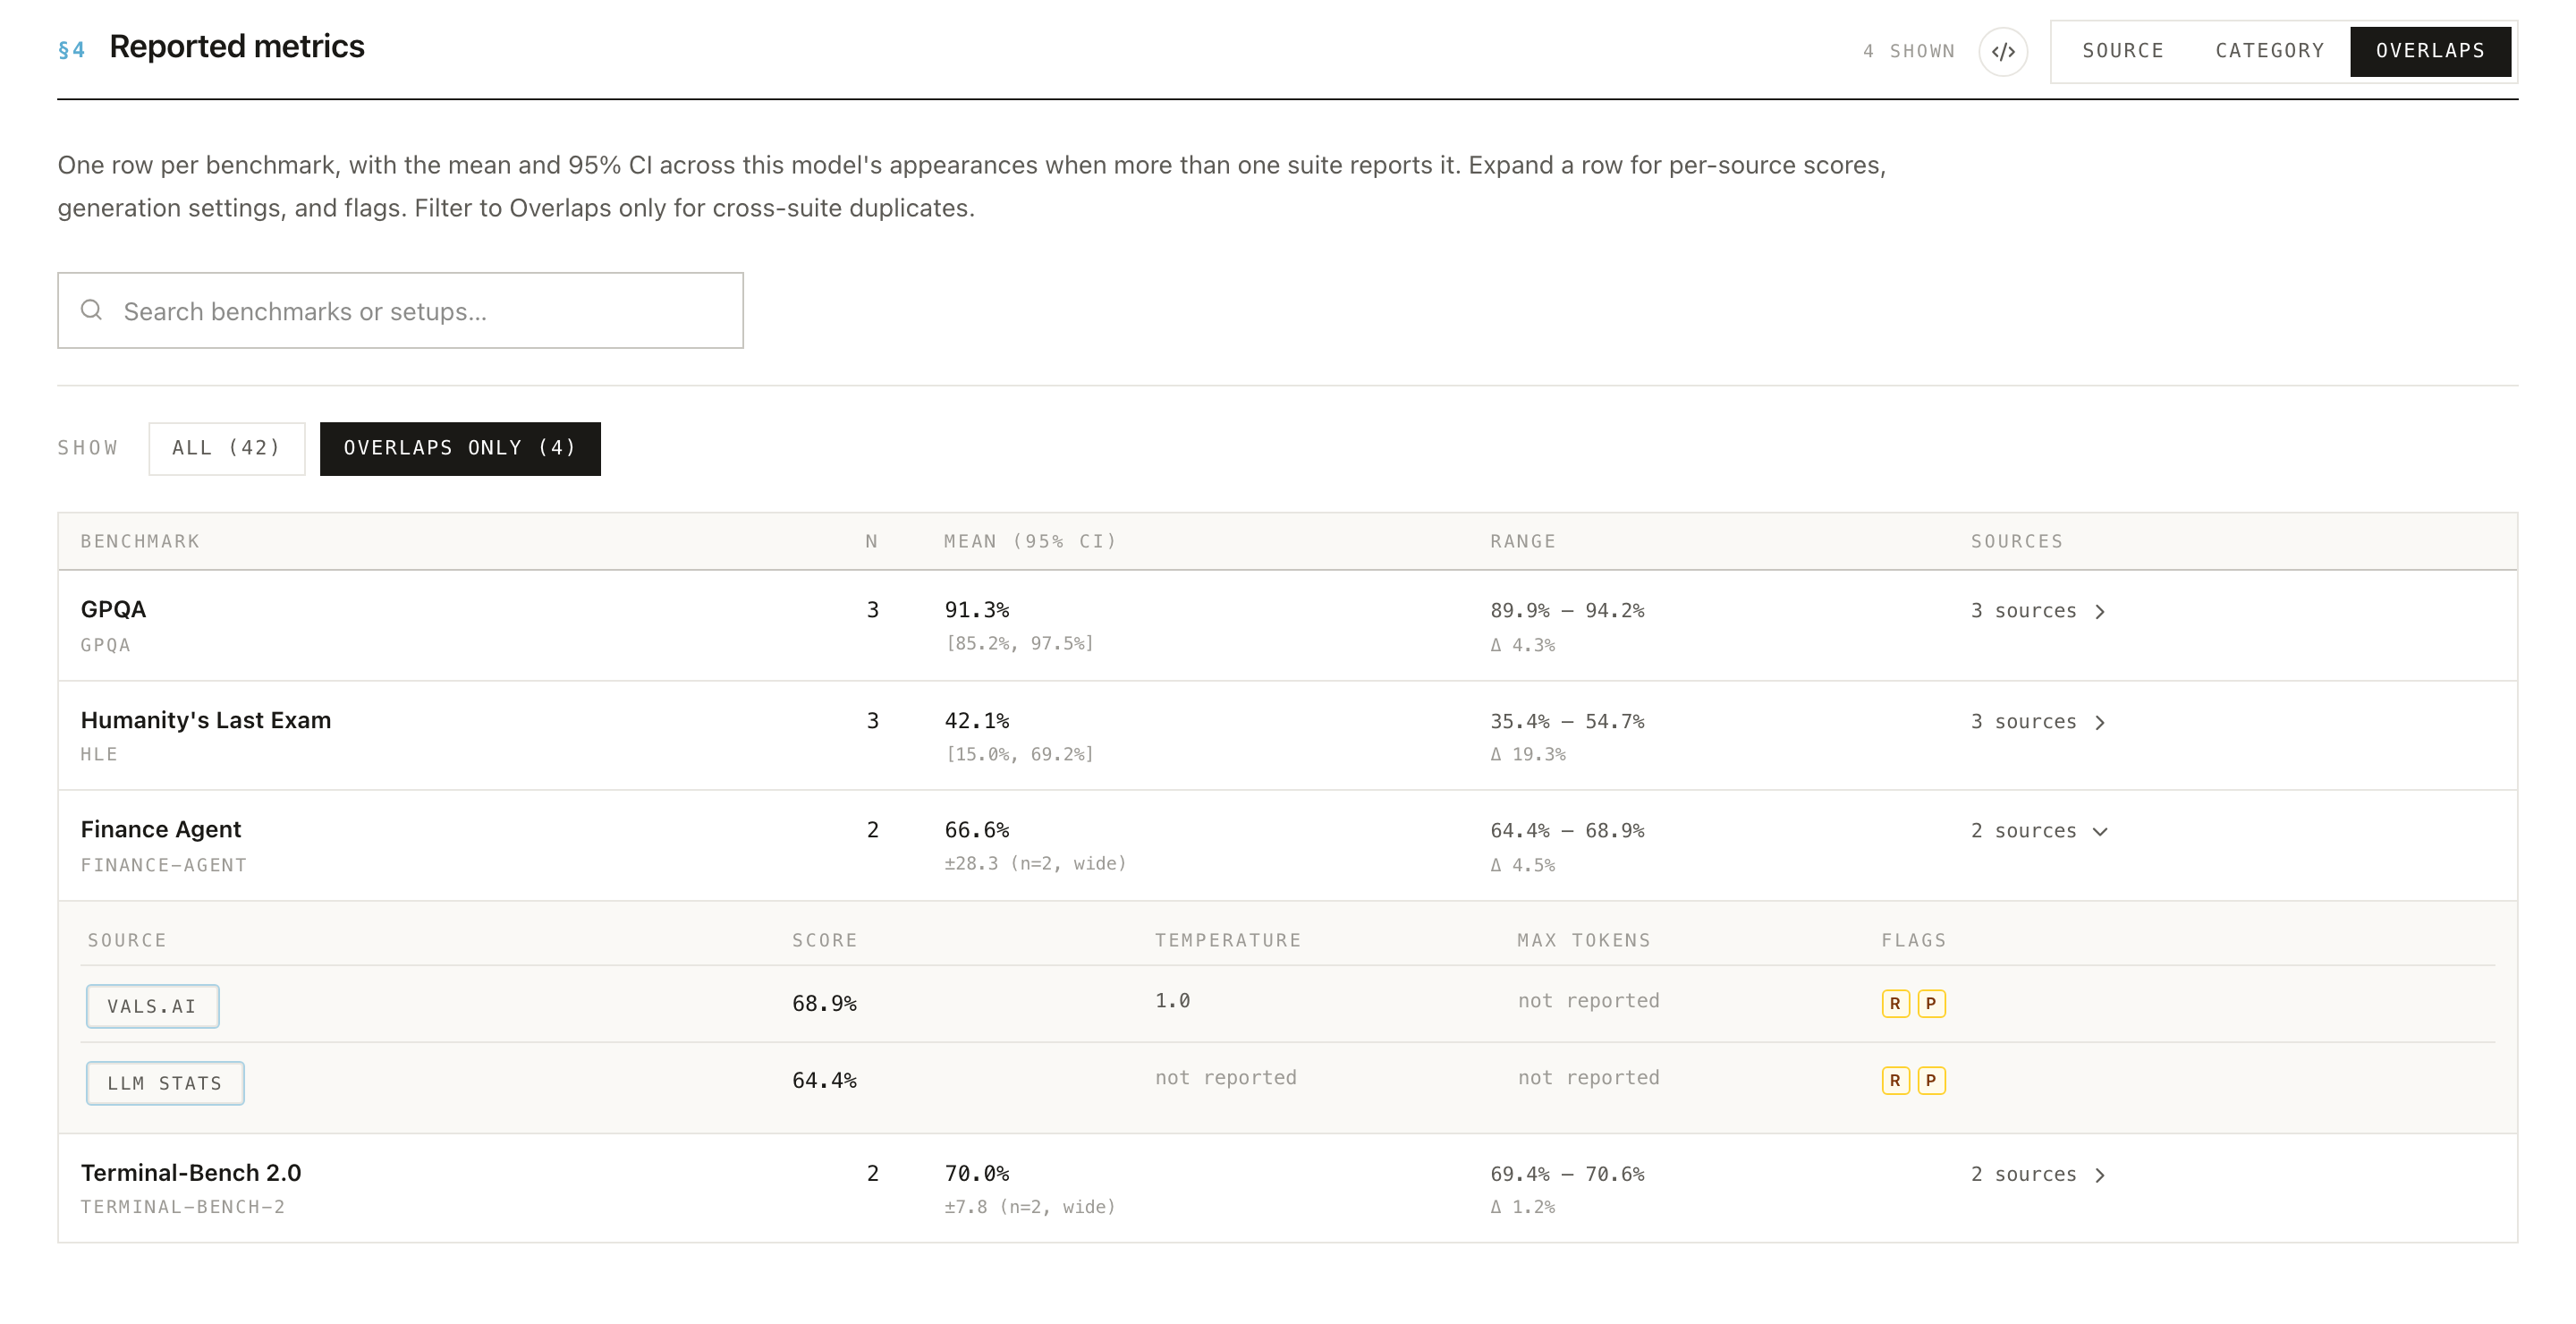
In Researcher View, §4 lists one row per benchmark with the number of results (N), the mean and 95% CI, and the range of reported scores. Expand a row to see each source's score, its generation settings, and the per-result flags showing which signals each result trips. That's the spread and provenance behind the summary number.
- Note the snapshot date. Every model and evaluation page shows a snapshot date in that same top bar (e.g. Snapshot · Jun 9, 2026), and the homepage shows it in the Corpus snapshot header. The corpus is versioned, so numbers change between snapshots. Cite the snapshot date with any figure so others can find exactly what you saw.
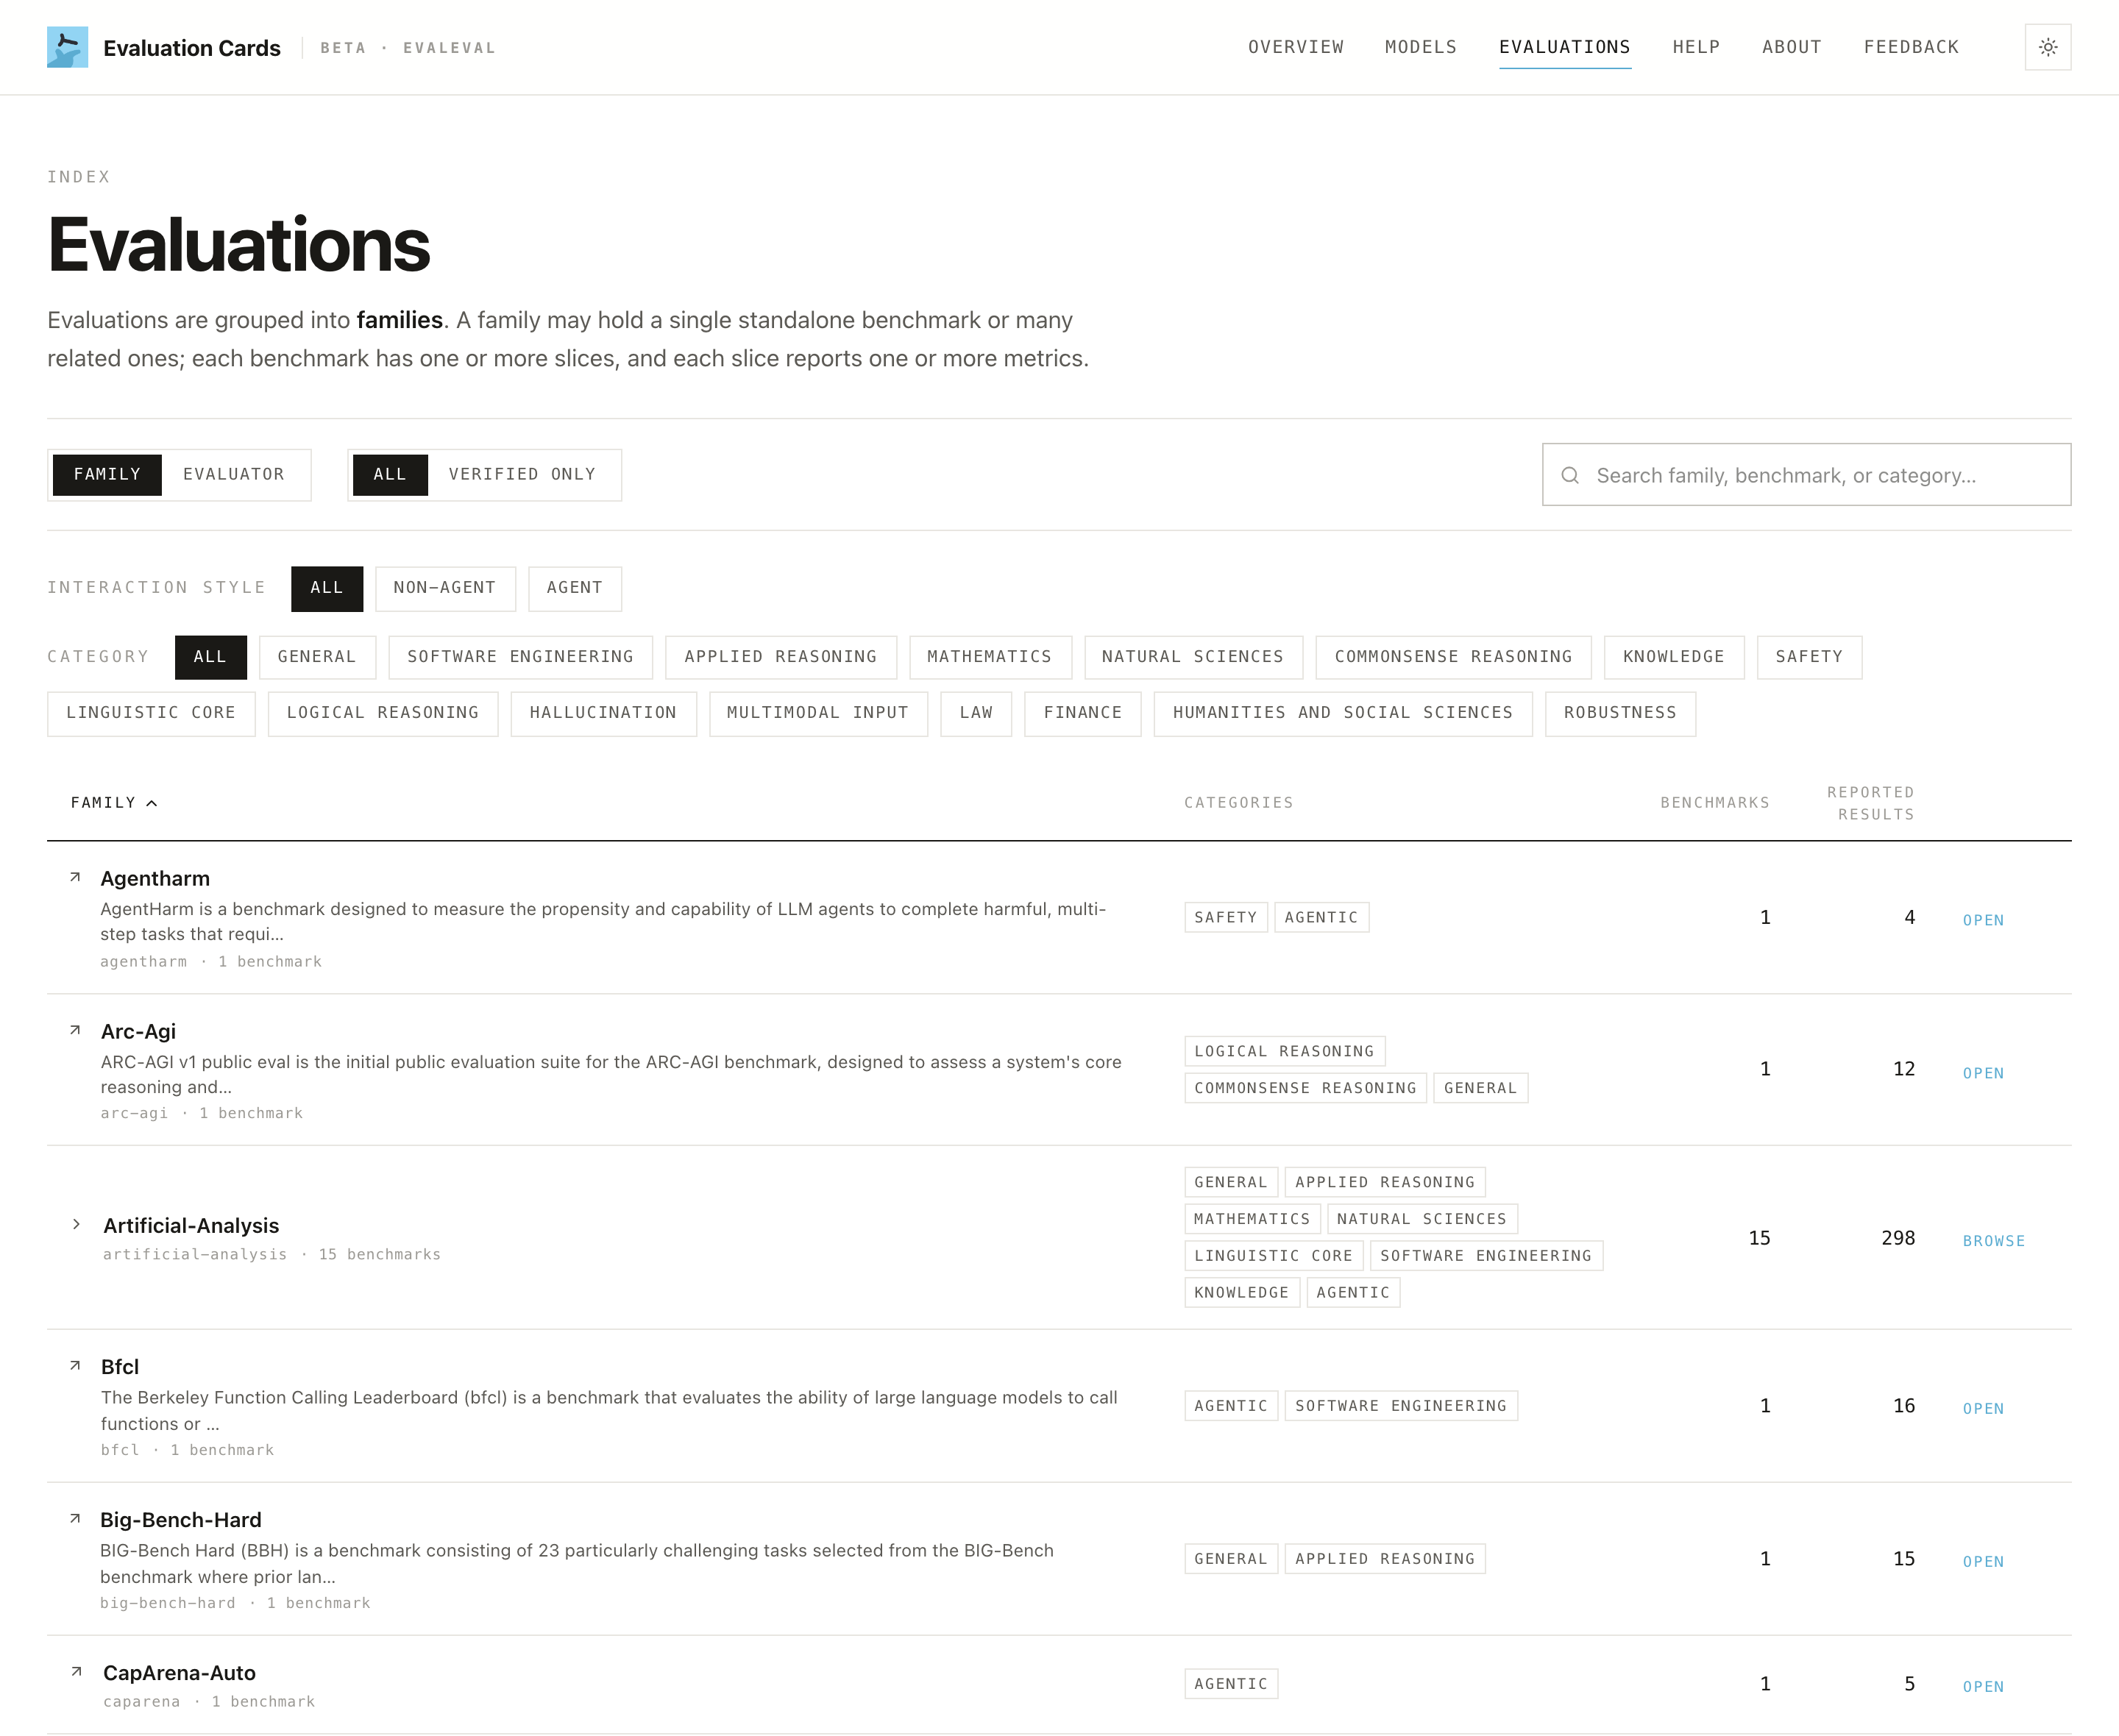
Browsing evaluations
The Evaluations tab is the benchmark-first view. Benchmarks are grouped into families and tagged by category; filter by interaction style (agent / non-agent) or by category to narrow the list.
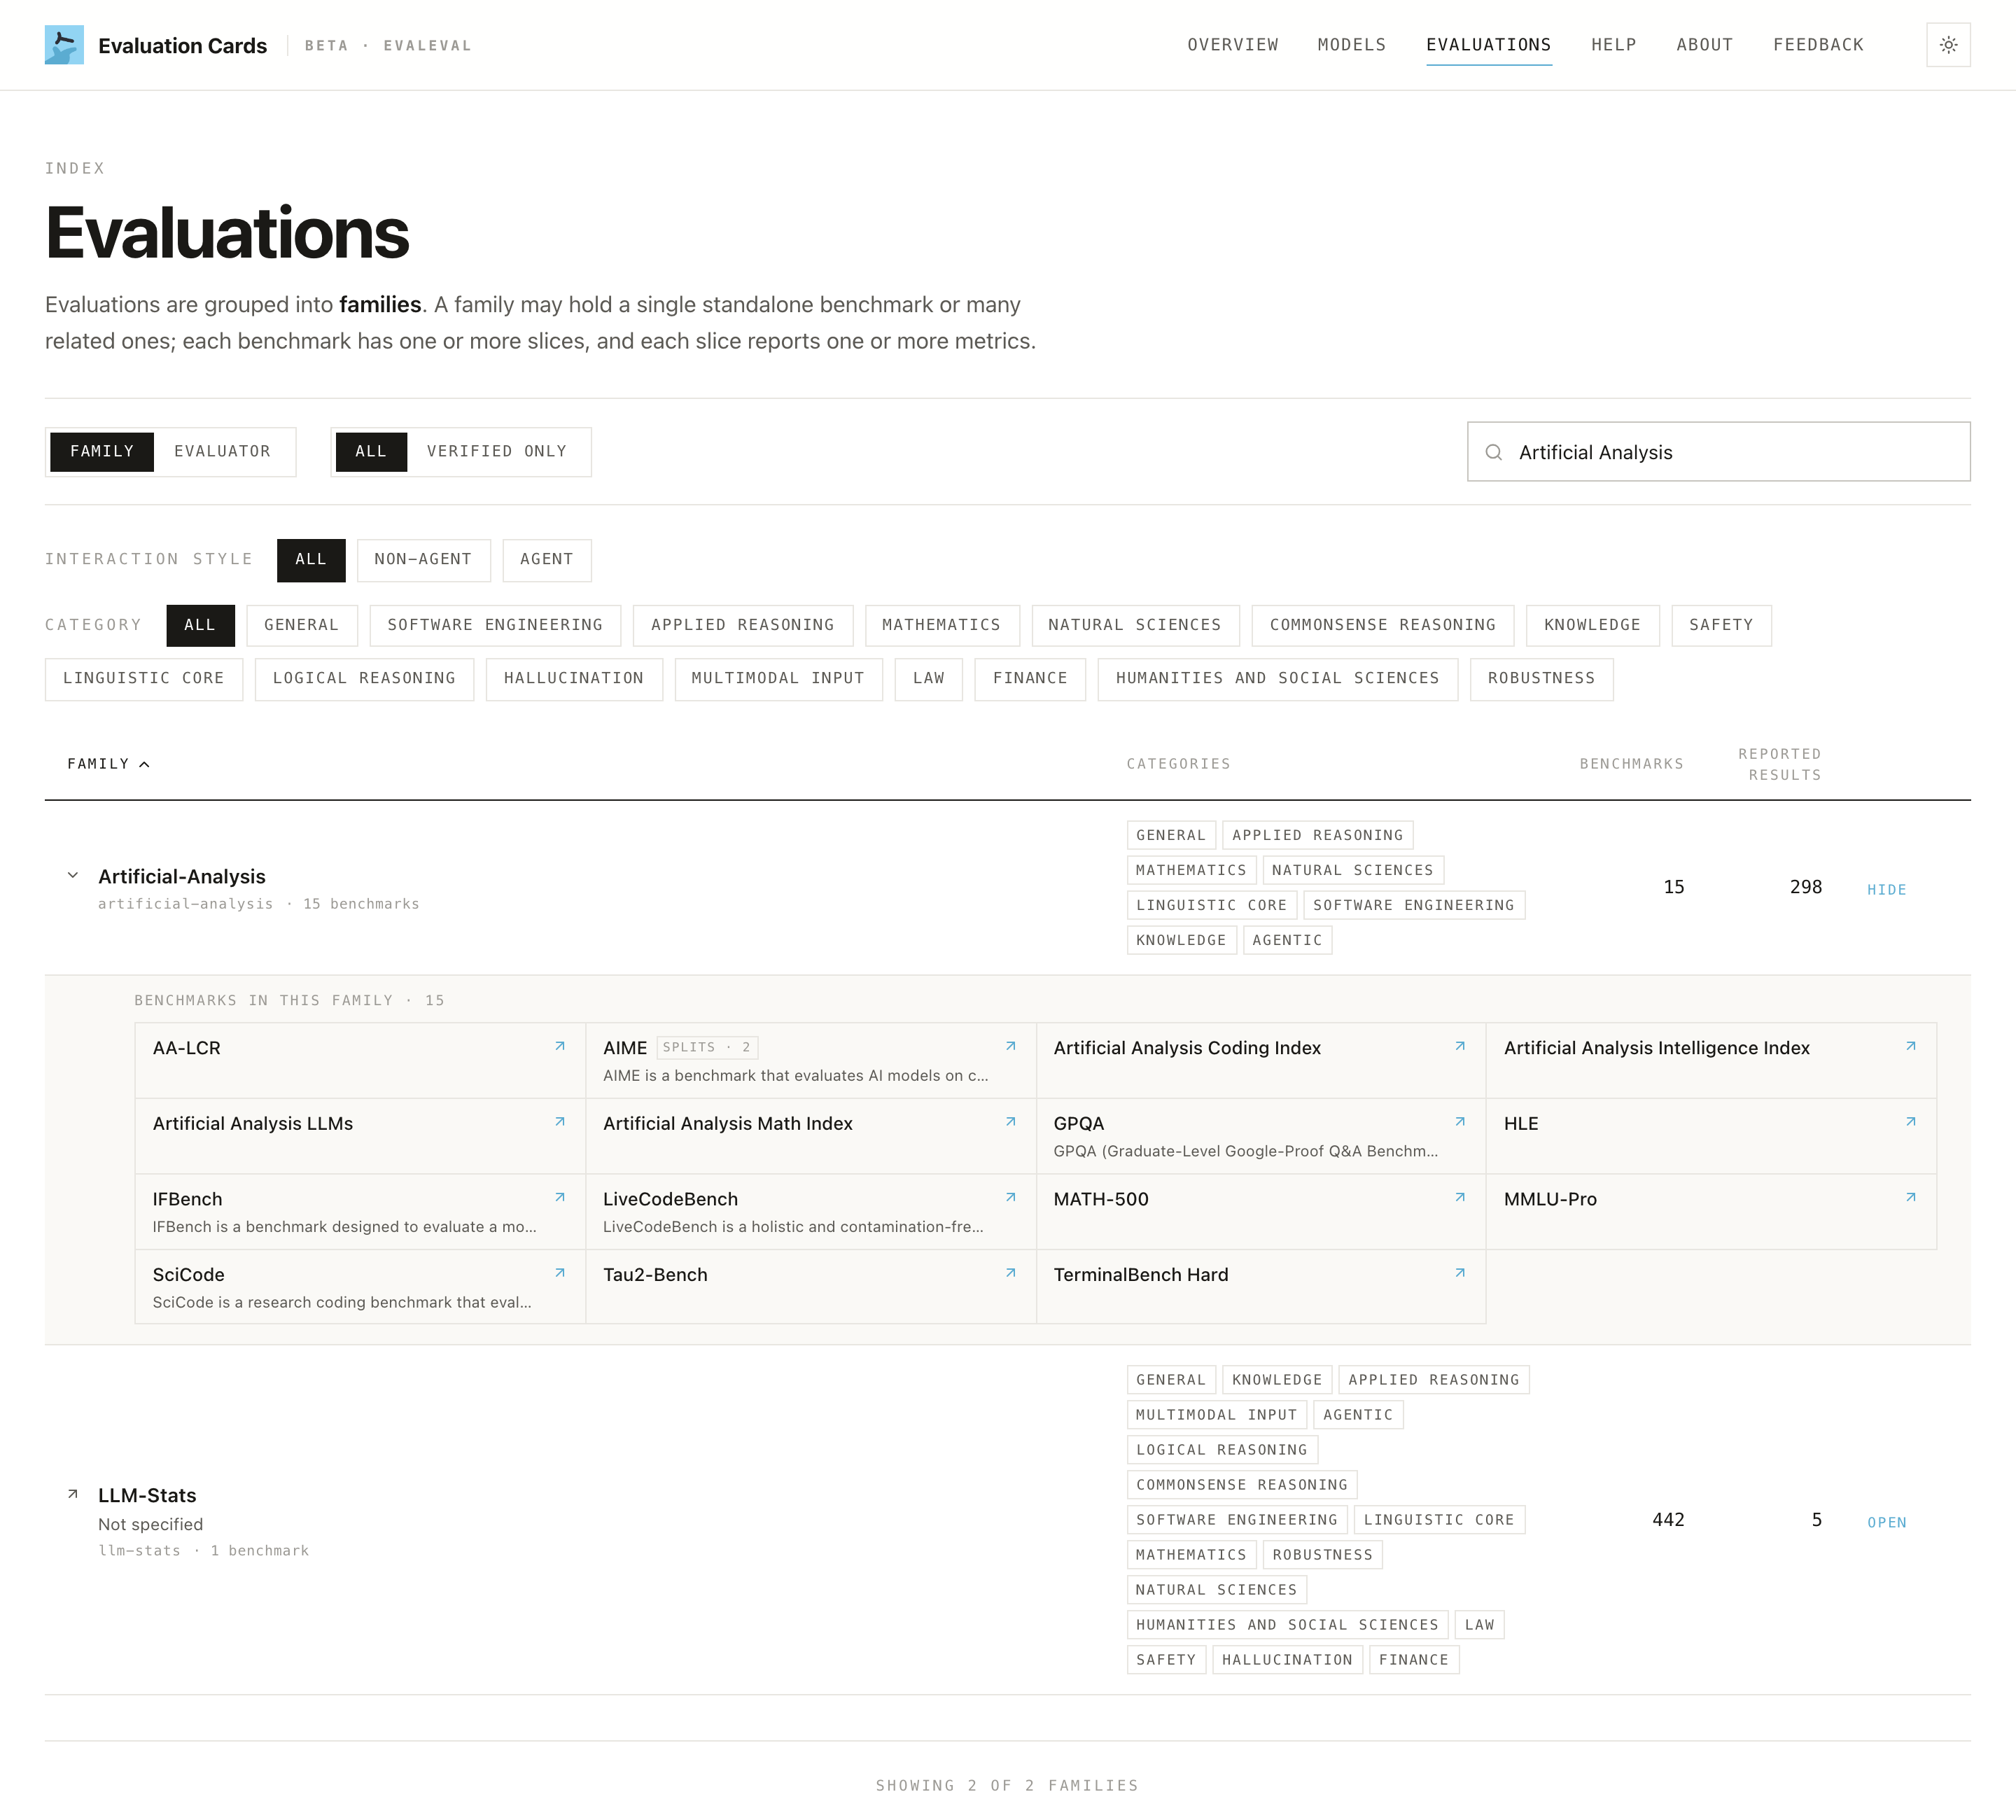
Open a family to drill into its structure: the single benchmarks beneath it, their splits, and the metrics reported on each, following the same five-level hierarchy top-down.
Walk through one evaluation
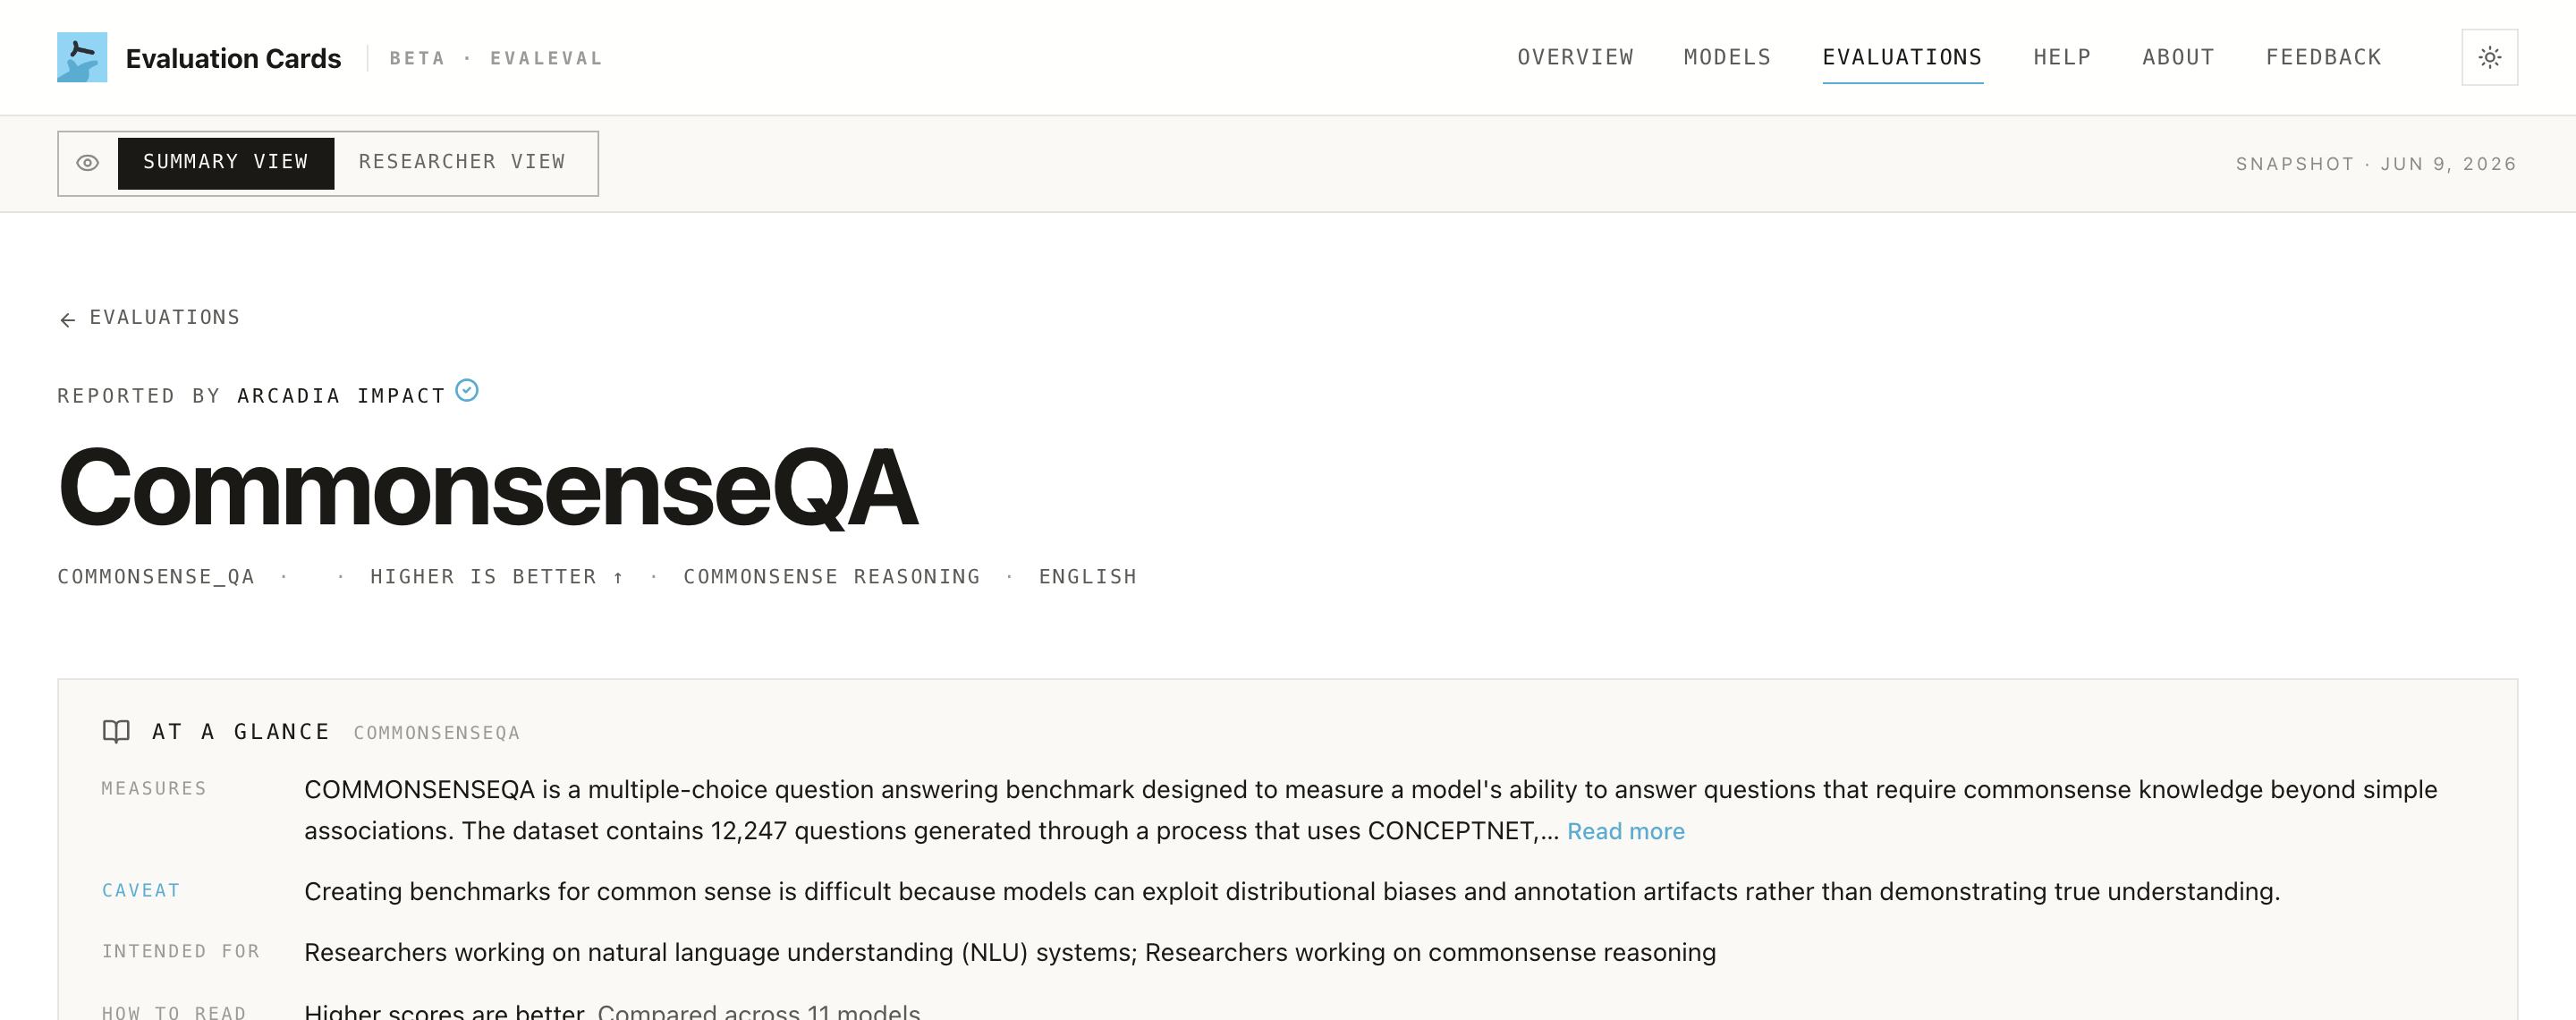
Click a benchmark to open its own page. The At a glance card at the top summarizes what it measures, its main caveat, who it's intended for, and how to read it, with links to the source paper and dataset. Below sit the Benchmark card (schema, methodology, what it measures), Technical details (metric, completeness, comparability, splits), and a "Can these scores be compared directly?" panel.
Scroll to Reporting Comparison: every model with a reported result on this benchmark, ranked, with the score distribution, the evaluator, the source, and the date. It's the benchmark-centric mirror of the §4 metrics on a model page.
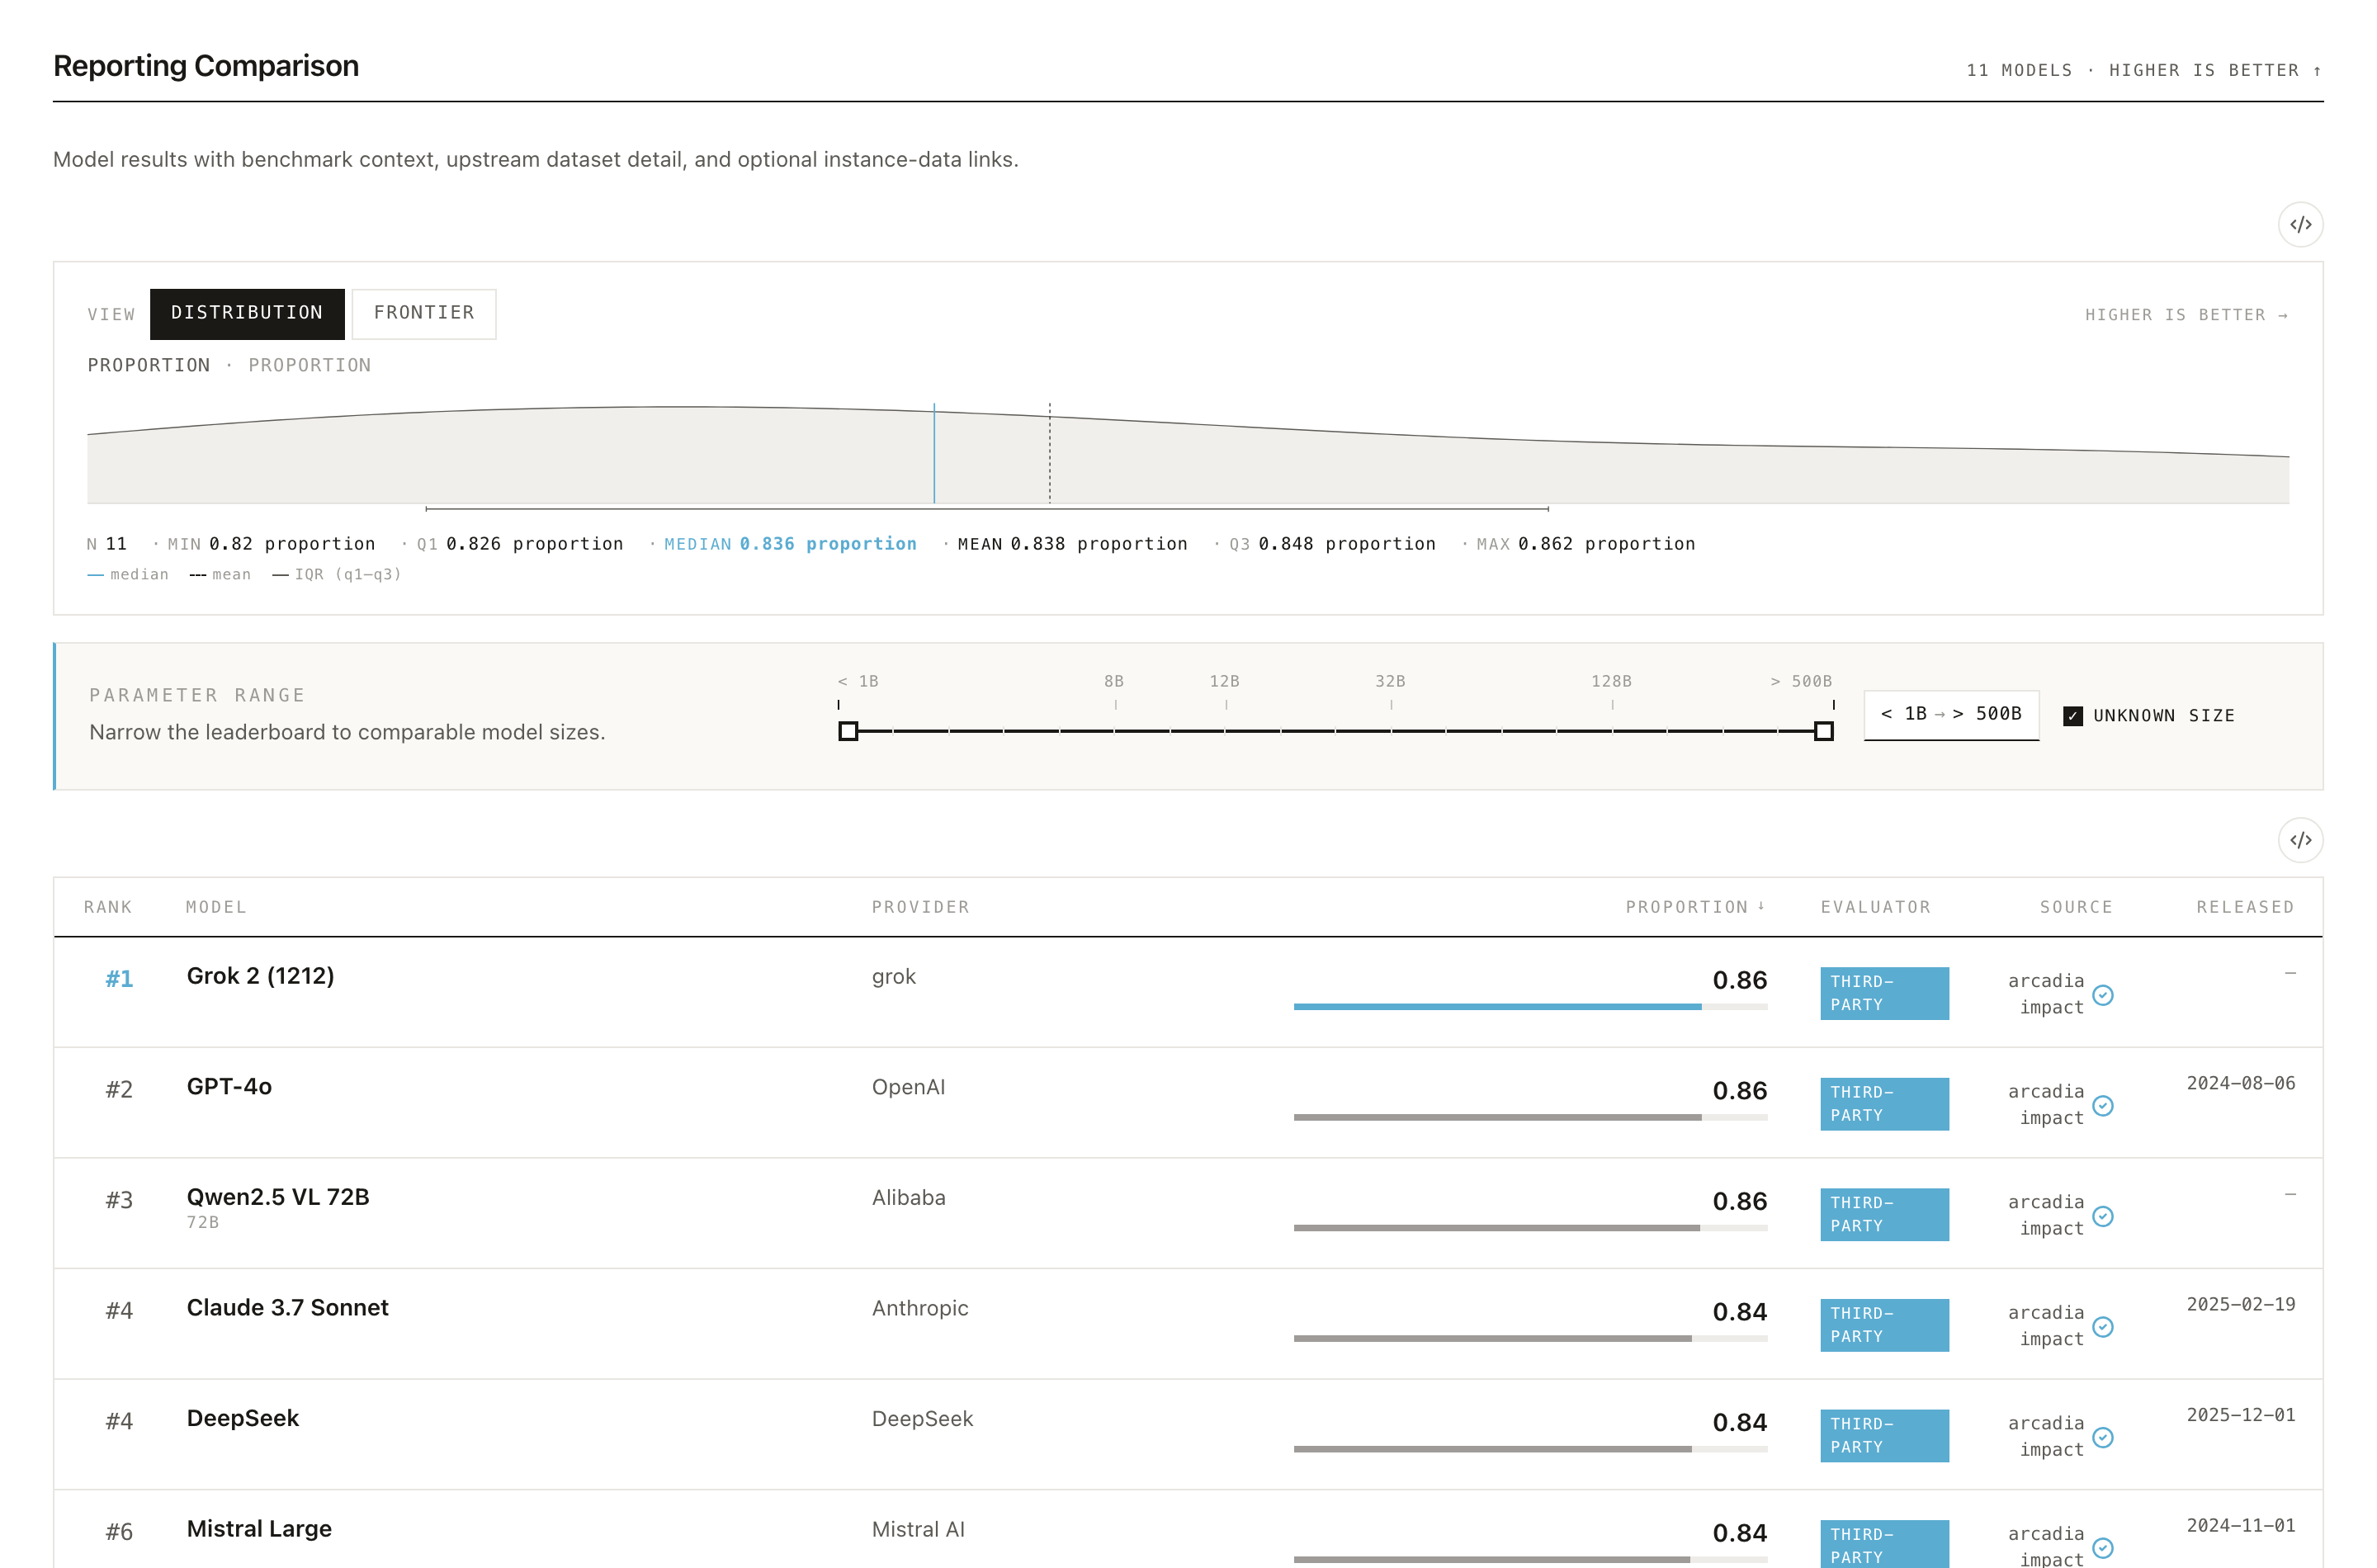
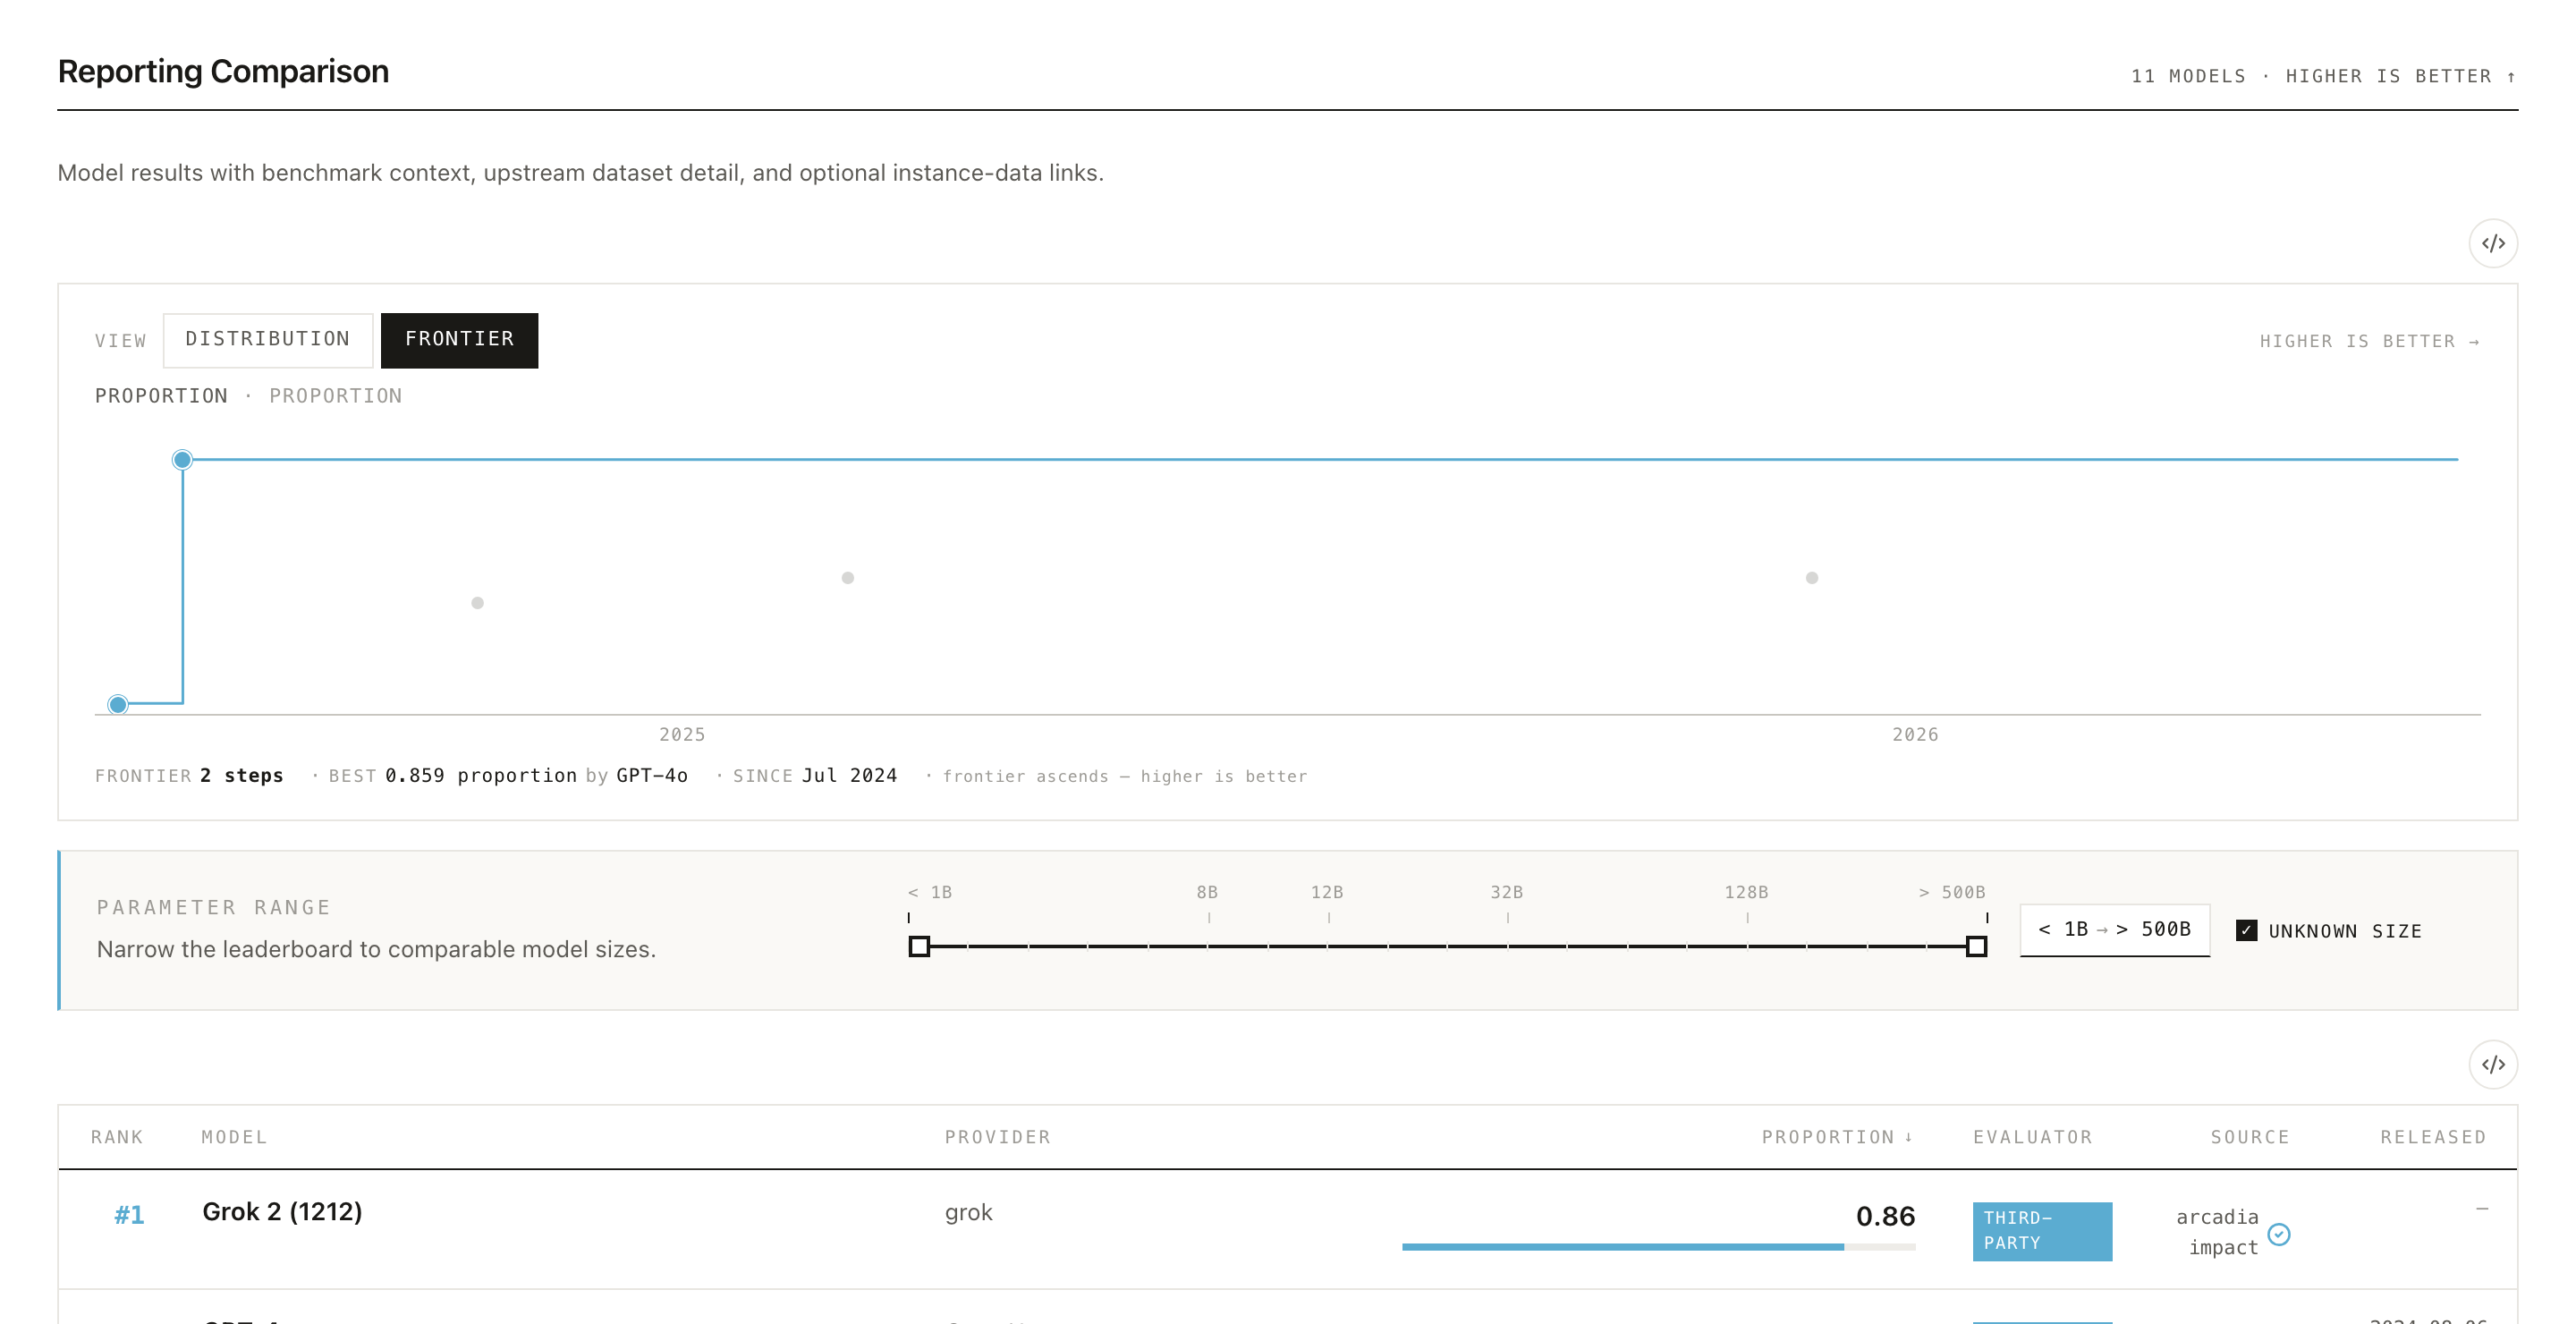
The chart above the leaderboard has two views, toggled at the top. Distribution shows how all the reported scores are spread across models; Frontier traces the best score over time, showing how the state of the art on this benchmark has advanced as newer models were released.
Three things to remember
- A score is a claim, not a fact. Read the signals before trusting the number.
- First-party ≠ third-party. Always check who produced a result.
- Cite the snapshot. The corpus is versioned; numbers change.
Support this effort
Evaluation Cards is a community effort from the EvalEval Coalition, and it gets more useful the more people use, report to, and cite it. If it helps your work, please cite our paper and share it with colleagues. Every role has a concrete way to pitch in: model developers can report their evaluations, evaluation developers can upload their benchmarks, researchers and policymakers can cite and share the work, and anyone can flag a correction. See how to contribute for the details.
➡️ Next: pick the guide for your role: Evaluation researchers · Policymakers · General public · Journalists.